Forex grid trading is one of the most systematic and automated approaches to capturing profits from range-bound currency markets. This guide covers exactly how to implement a grid trading strategy — spacing, risk management protocols, and our free SteadyPips GridMaster EA.
Whether you’re trading with $500 or $2,000, this guide walks through the mechanics, the spacing math, and the risk controls that decide whether a grid survives its first real trend.
Quick Answer
A forex grid trading strategy places buy and sell orders at fixed price intervals above and below an anchor price, each carrying a take profit of exactly one interval, so the profit source is price oscillation rather than a directional forecast. Spacing is derived from the pair’s own volatility — ADR(20) / N with N typically between 4 and 8 — and floored at a multiple of the typical spread so costs stay a small share of each round trip. The number of levels per side is set by capital, not preference: the whole stack on one side has to be survivable if it fills, which is also the strategy’s defining risk.
Strategy Parameters at a Glance
| Parameter | Rule used in this guide |
|---|---|
| Grid spacing | ADR(20) / N, with N typically 4 to 8 |
| Spacing floor | At least K × typical spread; at K = 10 the spread is about a tenth of the gross target |
| EUR/USD spacing, normal volatility (ATR 40–80 pips) | 20–25 pips |
| EUR/USD spacing, low volatility (ATR < 40 pips) | 15–20 pips |
| Take profit per order | Exactly one spacing interval, with no discretionary override |
Levels per side (L) | Capped so a fully filled side stays inside your accepted floating drawdown |
| Lot size per level | lot <= (D x equity) / (pip_value x spacing x L x (L + 1) / 2), rounded down |
| Lot progression | Fixed at every level — no escalation or recovery multiplier |
| Position cap | L per side; at the cap, no new orders for any reason |
| Equity stop | A fixed percentage drawdown from equity peak, set before launch |
| Spacing review cadence | Recompute ADR monthly; re-derive spacing if it moves by a quarter or more |
SteadyPips derives grid spacing from measured volatility rather than a preset: spacing is ADR(20) / N with N between 4 and 8, floored at roughly 10 × the pair’s typical spread, and recomputed monthly (SteadyPips grid trading strategy guide, as of August 2026). We publish no measured backtest table for GridMaster, because a grid’s equity curve looks smooth right up until the move that ends it — see our backtest results and methodology for what we do and do not stand behind.
New to grid trading? Start with our plain-English primer — What Is Grid Trading? — for the core concept and a worked example, then come back here for the spacing, settings, and risk controls that decide how it behaves.
Where this page sits. This is the strategy hub for the grid method. Three companion pages take over where this one stops: what is grid trading for the definition, how to set up grid trading for the step-by-step build, and dynamic grid trading for the volatility-adaptive variant that replaces fixed spacing with an ATR-derived interval.
Want to skip the manual setup? Download our free GridMaster EA for MT4 and MT5 — it automates grid trading with configurable risk limits, a drawdown cap, and EUR/USD defaults you can adjust. No coding required.
Grid trading is a natural fit for automation, since the ladder of orders it requires is tedious to manage by hand. If you haven’t used an Expert Advisor before, that guide covers how EAs work in general before you hand a grid strategy over to one.
How Forex Grid Trading Works (Step-by-Step)
Understanding the mechanics of forex grid trading is essential before deploying any automated system. Here’s the complete step-by-step process:
Step 1: Identify Your Price Range Select a currency pair in a clear ranging market with defined support and resistance levels. Plot these levels on your chart—this is your grid boundary. The distance between support and resistance determines your total grid size.
Step 2: Calculate Grid Spacing Divide the total range by your number of grid levels. For EUR/USD in a 100-pip range with 5 levels per direction, spacing would be 100 ÷ 5 = 20 pips per level. Refer to the EUR/USD average daily range data to establish realistic spacing based on current volatility.
Step 3: Place Buy and Sell Orders Your EA places mirror buy and sell limit orders at each grid level. As price oscillates down, buy orders trigger; as price moves up, sell orders trigger. Each order contains its own take-profit level (typically 15-25 pips for EUR/USD).
Step 4: Manage Position Accumulation Set maximum position limits (typically 5-10 per direction) to prevent excessive capital exposure. Once the maximum is reached, new orders pause until positions close.
Step 5: Execute Exit Strategy When price reaches take-profit levels, positions close automatically. In strong trends, equity stops and trailing stops prevent catastrophic drawdowns.
Step 6: Monitor and Adjust Track win rate, average profit per trade, and maximum drawdown. Adjust spacing quarterly based on volatility changes.
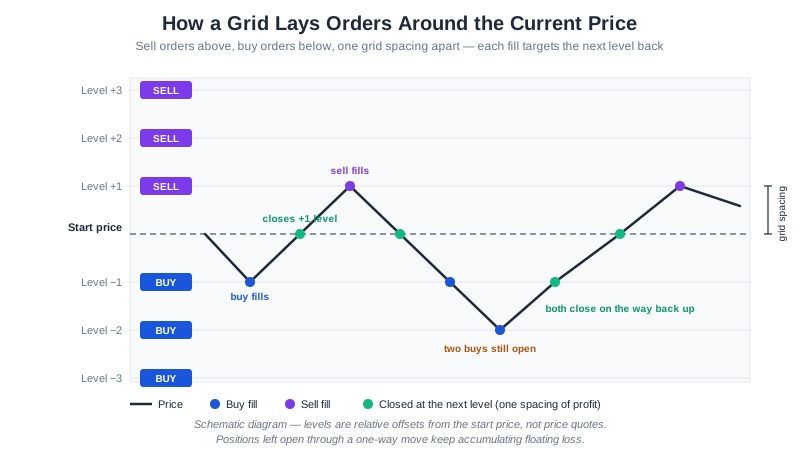
The levels in that diagram are offsets from wherever price sits when the grid is anchored, not particular quotes — a grid does not care where the market is trading, only how much it moves.
Optimal Grid Spacing for EUR/USD
The most critical variable in forex grid trading is grid spacing. The table below is configuration guidance derived from the volatility bands themselves — it is not the output of a backtest, and we do not publish a measured backtest table for a grid configuration (see backtest methodology and results for the EAs we do have tested figures for):
| Market Volatility | Recommended Spacing | Best For |
|---|---|---|
| Low (ATR < 40 pips) | 15-20 pips | Tight ranges, scalp profits |
| Normal (ATR 40-80 pips) | 20-25 pips | Balanced risk/reward |
| High (ATR > 80 pips) | 30-40 pips | Protection from trends |
| Extreme (News events) | 50+ pips | Survival mode |
EUR/USD is a natural fit for forex grid trading because it trades in relatively stable ranges with tight spreads. How many positions a given configuration closes per day is not something we have measured, and it is not a fixed property of the settings — it is structural arithmetic: a grid with spacing s closes one position for every s pips of round-trip oscillation the session happens to deliver, so the count rises with volatility and falls to zero in a one-way move where levels fill and stay open. Estimate it for your own settings by dividing your measured daily range by your spacing, and treat the result as an upper bound rather than an expectation. See our complete ranking of the best forex pairs for grid trading for pair-by-pair spacing recommendations.
The table above assumes you re-read volatility periodically and reset the interval by hand. The alternative is to let the grid do it: dynamic grid trading derives the spacing from a live ATR reading on every recalculation, so the same configuration widens through a news window and tightens again in a quiet Asian session without you touching the inputs.
Grid Trading vs. Martingale vs. DCA Comparison
| Feature | Forex Grid Trading | Martingale | Dollar-Cost Averaging (DCA) |
|---|---|---|---|
| Direction | Bidirectional (buys & sells) | Unidirectional (adds on loss) | Unidirectional (buys only) |
| Market Type | Ranging/sideways | Trending (risky) | Uptrending |
| Position Accumulation | Systematic & controlled | Exponential & dangerous | Linear & steady |
| Risk Management | Position limits + equity stops | Lacks protective mechanisms | Stop-losses recommended |
| Profit Source | Oscillation between levels | Trend reversal (unreliable) | Long-term appreciation |
When to Avoid Grid Trading
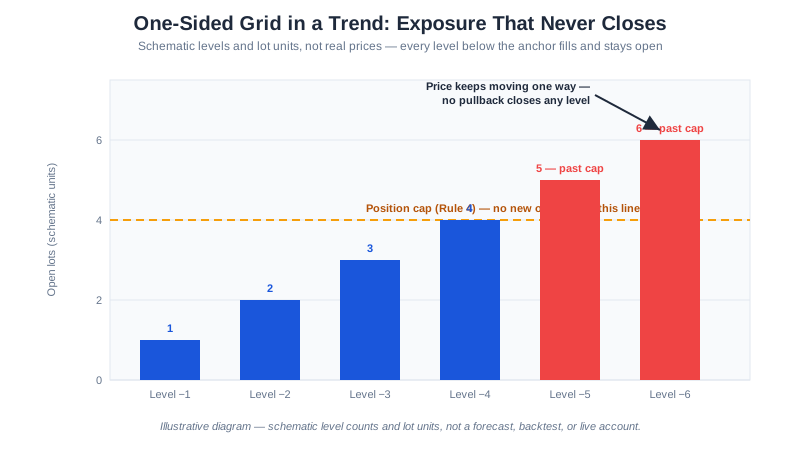
Grid trading is dangerous during strong trends. If EUR/USD moves 200+ pips in one direction without a meaningful pullback, all grid levels on the wrong side get filled simultaneously, creating massive drawdown.
Those conditions are not dead time, they are a different job: the range break that disqualifies a grid is exactly the event a rule-based breakout strategy is built to trade, defined with the same ATR-multiple range measurement the filter below uses to decide a grid should stand down.
Warning signs to pause your grid:
- ADX above 40 (strong trend in progress)
- Price breaking multi-week highs/lows
- Major central bank policy shifts
- Geopolitical events causing one-directional moves
A Rule-Based Grid Blueprint
A grid is only as good as the rules wrapped around it. What follows is a blueprint rather than a settings file: every value is expressed as a condition or a formula, so you derive your own numbers from your own account size and your own pair’s volatility instead of inheriting someone else’s. Nothing below is a signal, a target, or a forecast.
1. Market-Condition Filter — Is a Grid Appropriate At All?
The first rule decides whether to run a grid this week, not how to configure one. A grid needs oscillation; deploying one into a directional market is the single most expensive mistake in the strategy. Require all of the following before any order is placed:
- Regime test. A trend-strength reading (ADX on H1 is the conventional choice) below your chosen threshold. Above it, treat the market as trending and stand down. A single threshold whipsaws the filter right at the boundary — see dynamic grid trading’s regime-detection section for the hysteresis band that fixes it.
- Range containment. The last N daily closes sit inside a band no wider than roughly 1.5 × ADR. A band that keeps widening session after session is a range in the process of breaking.
- Event window. No tier-one scheduled event for either currency inside the period you expect to hold positions — rate decisions, employment releases, inflation prints.
- Cost check. The pair’s typical spread is small relative to your intended spacing (see the formula below). If it is not, the pair is disqualified regardless of how well it ranges.
Fail any one condition and the correct response is to place no new orders. Widening the grid to “give it room” converts a filter failure into a larger position.
2. Entry Framework
- Anchor the grid at the current mid-price at the moment the filter passes. Do not attempt to time a low or a high — a grid that needs a good entry is not a grid.
- Place
Lbuy levels below the anchor andLsell levels above it, one spacing interval apart. - Every level carries a take-profit of exactly one spacing. No level gets a discretionary target, a wider target, or a manual override.
- Re-anchor only when the grid is completely flat and the market-condition filter still passes. Re-anchoring on top of an open stack is how a controlled grid becomes an uncontrolled one.
3. Spacing Formula
Spacing is derived from the pair’s own volatility, not chosen from a table:
spacing = ADR(20) / N          where N is typically 4 to 8
floor:   spacing >= K x typical spread
N is the trade-off dial. A larger N means narrower spacing, more fills per swing, and a faster-building position stack; a smaller N reverses all three. The K floor exists so the spread stays a tolerable share of each round trip — at K = 10 the spread consumes about a tenth of the gross target, and the arithmetic gets worse quickly below that.
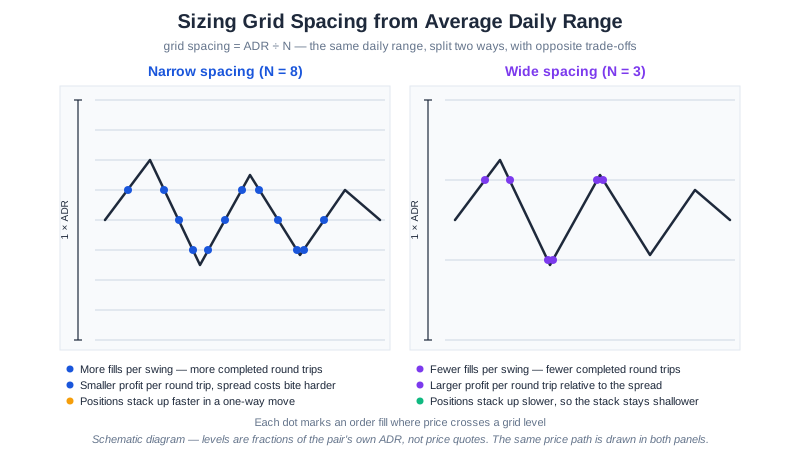
Recompute ADR monthly. If it has moved materially — a quarter or more in either direction — re-derive the spacing rather than leaving last quarter’s number in place. See our EUR/USD average daily range data for a worked source of the input.
Or skip the manual arithmetic: the grid spacing calculator applies this same ATR-multiplier-and-floor formula to a reading you enter, and also estimates how many levels your account can fund at the resulting spacing.
4. Per-Level Sizing Rule
Fixed lots at every level. No escalation, no recovery multiplier, no “just this once” doubling. The moment size grows with adversity, the risk curve stops being linear — see grid trading vs martingale for what that costs.
Size the lot from the worst case you are willing to absorb, not from the profit you would like. When one entire side is filled, the floating loss is the sum of the level distances:
MaxFloat = lot x pip_value x spacing x L x (L + 1) / 2

lot <= (D x equity) / (pip_value x spacing x L x (L + 1) / 2)
where D is the fraction of equity you accept as floating drawdown with a full side filled — a conservative starting point is well under a quarter, and the number should be decided before the grid runs, not during. Solve for lot, round down to your broker’s lot step, and if the answer is below the minimum tradeable size, the honest conclusion is that the account is too small for that value of L.
5. Hard Risk Limits
These are ceilings enforced by the software, not intentions:
| Limit | Rule |
|---|---|
| Max open positions per side | Capped at L. At the cap, no new orders are placed for any reason. |
| Equity stop | A fixed percentage drawdown from equity peak that closes everything, set before launch. |
| Total exposure | Sum of open lots capped independently of the level count. |
| Correlated exposure | One grid per exposure, not per symbol. Two grids long correlated majors are one position. |
| Gap protection | Flatten or reduce before the weekend if the stack is deep — a gap skips levels rather than filling them. |
6. When to Shut the Grid Down
Shutting down means stopping new orders and executing a pre-written decision on the open stack. Trigger it when any one of these is true:
- The equity stop is hit.
- The regime filter flips — trend strength above threshold, or the containment band breaks.
- One side reaches
Lfilled levels and price is still moving away from the anchor. - ADR has changed enough that the current spacing no longer satisfies the formula.
- A tier-one event has appeared inside the holding window.
Note what is not on that list: “price is nearly back to break-even.” That judgement made under pressure is the reason most grid accounts end where they do.
7. Failure Modes to Plan For
An honest blueprint names how it breaks. Most retail traders lose money, and a grid does not change that arithmetic — it only changes the shape of the loss.
- The one-way trend. The defining failure. Every level on one side fills, nothing closes, and the floating loss grows with the square of the distance travelled.
- Gaps. Weekend and post-event gaps jump levels instead of filling them, so entries land worse than modelled and take-profits can be skipped entirely.
- Spread widening. Round-trip costs rise exactly when volatility rises — the moment the grid is most active is the moment each round trip is worth least.
- Margin ends it, not price. A stop-out closes positions in the broker’s order, at the broker’s timing, not yours.
- Backtest flattery. A grid’s equity curve looks smooth right up until the move that ends it, which makes short test windows badly misleading. We publish no measured backtest table for GridMaster for exactly this reason — see our backtest results and methodology for what we do and do not stand behind.
- Parameter drift. Spacing derived from a volatility regime that has since passed will quietly mis-size every level.
- Over-fitting. Settings tuned until a historical window looks good have usually been tuned to that window’s noise.
The GridMaster EA implements the structural parts of this blueprint — fixed lots, a per-side position cap, a drawdown limit, an equity stop, and a weekend close — but the market-condition filter and the sizing decision remain yours. Running it requires a broker that permits hedging, allows EAs, and offers micro lots; XM meets those three requirements on MT4.
Getting Started with Grid Trading
The fastest way to start grid trading is with an automated Expert Advisor that handles order placement, risk management, and position sizing for you.
Download GridMaster EA — Free for MT4 & MT5 →
Our GridMaster EA includes:
- Automatic grid placement with configurable spacing
- Built-in equity protection and drawdown limits
- Dynamic lot sizing based on account balance
- One-click setup for EUR/USD, GBP/USD, and USD/JPY
No programming knowledge required. Just install, configure your risk settings, and let the EA manage your grid.
Build on This Guide
- What Is Grid Trading? — beginner’s primer on the core concept with a worked example
- Dynamic Grid Trading: ATR-Based Strategy — adapt grid spacing to volatility; the hypothetical backtest there shows a shallower drawdown than a static grid over the tested window
- How to Set Up Grid Trading in Forex — 10-step setup walkthrough
- Best Forex Pairs for Grid Trading — pairs ranked by range and spread cost
- Grid Trading vs Martingale — how the two approaches differ in risk
Trading foreign exchange carries a high level of risk and may not be suitable for all investors. Past performance is not indicative of future results. Always test on a demo account before trading live.
![Best Forex Pairs for Grid Trading: 7 Pairs Ranked [2026]](/images/charts/best-forex-pairs-for-grid-trading-ranging-vs-trending.svg)