GridMaster EA Setup Guide
Grid trading opens multiple positions as price moves, so every input below changes how much of the account is exposed at once. This is a walkthrough, in order: confirm your capital fits the ladder depth you want, start from a preset rather than hand-picking inputs, know the drawdown arithmetic before you attach the EA, and check the off-switch conditions before you walk away from it. If you haven’t read our grid trading strategy guide yet, it explains the concepts these settings implement.

Quick Answer
Start from the baseline settings — GridSizePips 20, GridLevels 5, TakeProfitPips 20, StartLotSize 0.01, LotMultiplier 1.0, MaxDrawdownPercent 20, EquityProtectionPercent 70, CloseOnFriday true — then move to the preset that matches your balance. Conservative is 25-pip spacing, 3 levels and a 15% drawdown cap; Moderate is 20 pips, 5 levels and 20%; Aggressive is 15 pips, 7 levels, 30% and a 1.2 LotMultiplier that grows position size at each level, which is a different risk shape rather than more of the same. Capital follows ladder depth: 3 levels needs at least $200, 5 levels $300, 7 levels $500, 10 levels $1,000. On the Moderate preset at flat 0.01 lots on a $500 account, the 20% MaxDrawdownPercent gate stops new orders after roughly 260 pips of one-directional movement and EquityProtectionPercent force-closes everything at about 360 pips — both are late-stage brakes, not prevention.
Step 1: Confirm Your Capital Requirements
Minimum recommendations by ladder depth:
| Grid Levels | Min Account | Recommended |
|---|---|---|
| 3 levels | $200 | $300 |
| 5 levels | $300 | $500 |
| 7 levels | $500 | $1,000 |
| 10 levels | $1,000 | $2,000 |
The $200 floor matches the practical minimum in our funding guide: below it, computed lot size falls under the 0.01 minimum for any EA, grid or otherwise. Check where your own balance lands with the position-size calculator before picking a level count.
Step 2: Start From the Baseline Settings
GridSizePips = 20
GridLevels = 5
TakeProfitPips = 20
StartLotSize = 0.01
LotMultiplier = 1.0     (flat lot size across every level)
MaxOpenPositions = 10
MaxTotalLots = 0.5
MaxDrawdownPercent = 20
EquityProtectionPercent = 70
CloseOnFriday = true
FridayCloseHour = 20
Step 3: Choose a Risk Profile
Conservative (Recommended for Beginners)
GridSizePips = 25
GridLevels = 3
LotMultiplier = 1.0
MaxDrawdownPercent = 15
MaxOpenPositions = 6
Moderate
GridSizePips = 20
GridLevels = 5
LotMultiplier = 1.0
MaxDrawdownPercent = 20
MaxOpenPositions = 10
Aggressive (Experienced Only)
GridSizePips = 15
GridLevels = 7
LotMultiplier = 1.2
MaxDrawdownPercent = 30
MaxOpenPositions = 14
In every preset, MaxOpenPositions is exactly double GridLevels (6=2×3, 10=2×5, 14=2×7) — not a coincidence. GridLevels sets ladder depth on one side of price; MaxOpenPositions caps both sides combined, not extra depth on one direction.
Step 4: Pick Pairs That Suit Grid Trading
| Pair | Grid Size | Why |
|---|---|---|
| EUR/USD | 20 pips | Tight spreads, ranges well |
| USD/CHF | 20 pips | Mean-reverting, tight spreads |
| EUR/GBP | 15 pips | Low volatility range pair |
| AUD/NZD | 15 pips | Tight historical range |
Avoid: GBP/JPY and volatile exotics — extended trends are the failure mode below.
Every GridSizePips value above is a single number chosen for that pair’s typical behaviour, which means it stops fitting the moment volatility shifts. If you would rather have the spacing track the market instead of being re-entered by hand, our guide to dynamic grid trading walks through deriving the interval from ATR and shows how a dynamic ladder behaves differently from a fixed one through a volatile session — or run today’s ATR reading through the grid spacing calculator to get a GridSizePips figure without doing the arithmetic yourself.
Step 5: Know Your Drawdown Before You Attach the EA
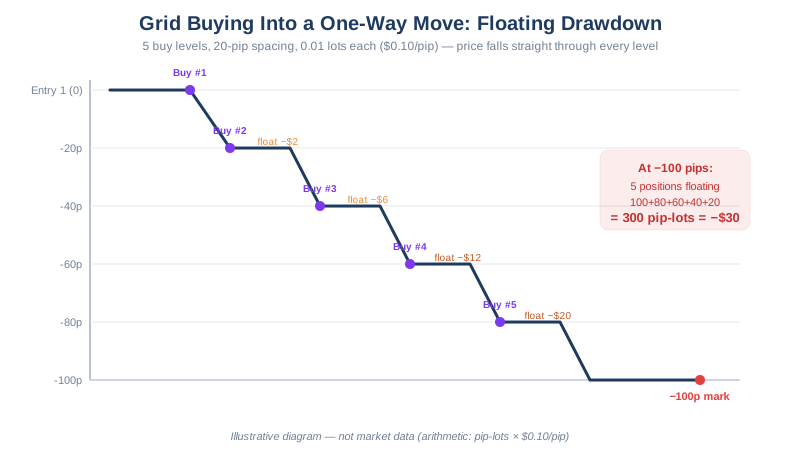
Moderate preset — 5 levels, 20-pip spacing, 0.01 lots, LotMultiplier = 1.0 — worked on a $500 account, one direction only, no take-profit fills: the worst case, a sustained trend rather than a range.
A 0.01 lot on EUR/USD is worth roughly $0.10/pip (lot sizing math). Level 1 fills at 20 pips adverse, level 2 at 40, level 3 at 60, level 4 at 80, level 5 at 100 — each opening a fresh position. The first position opened has run longest and sits furthest underwater once the last level fills.
| Price move from center | Combined floating loss | % of $500 |
|---|---|---|
| 100 pips (5 of 5 filled) | $20.00 | 4.0% |
| 150 pips | $45.00 | 9.0% |
| 260 pips | $100.00 | 20.0% — MaxDrawdownPercent blocks new orders |
| 360 pips | $150.00 | 30.0% — equity hits 70% of balance, EquityProtectionPercent closes everything |
Once all 5 levels have filled (D ≥ 100 pips from center), combined floating loss in pips is 5D − 300 (each position sits D minus its own entry distance — 20, 40, 60, 80, or 100 — underwater). Multiply by $0.10/pip: at D = 260, 5(260) − 300 = 1,000 pips × $0.10 = $100.00, the 20% mark exactly.
The takeaway isn’t “equity protection saves you at 70%.” At these flat 0.01-lot settings it barely gets tested in a normal market — our own EUR/USD daily range data puts a typical day at 60-90 pips, so 360 pips adverse needs several straight days trending one way with no pullback: real, but uncommon. The 20% MaxDrawdownPercent gate (≈260 pips here) does the everyday work, blocking new orders while the five already open keep floating until price recovers or EquityProtectionPercent closes them.
Step 6: Understand Why LotMultiplier > 1.0 Changes the Strategy
Conservative and Moderate both use LotMultiplier = 1.0 — floating loss grows in a straight line, exactly the table above. Aggressive changes that: LotMultiplier = 1.2 means each level is 1.2× the one before it. By level 7 that compounds to 1.2⁶ ≈ 2.99 — the deepest level carries roughly three times the size of level 1. At 1.3, level 7 is nearly five times the first (1.3⁶ ≈ 4.83).
That’s the mechanism worth naming: a lot multiplier makes your largest position the one opened furthest into an adverse move, exactly when the trade has already gone wrong the most — a smaller, slower version of the shape that makes martingale dangerous. Grid trading vs martingale covers why exponential position growth turns a bounded loss into an unbounded one. We do not recommend Aggressive, or any LotMultiplier above 1.0, to anyone who has not run arithmetic like the table above for their own balance and cannot state their worst-case exposure before enabling it.
Step 7: Know When to Switch This EA Off
Grid trading bets on oscillation, not a committed direction. Some conditions make that bet worse than usual:
- A strong, established trend. Higher highs (or lower lows) for several sessions with no pullback means every new level opens further into the move.
- Pre-central-bank windows. The hour around an FOMC, ECB, or BOE decision routinely produces moves several multiples of a grid’s spacing, in seconds.
- Thin holiday liquidity. Late December, early January, and major holidays widen spreads and thin the oscillation grid trading depends on, while making a stray large move more likely.
- Correlated grids running concurrently. GridMaster on both EUR/USD and USD/CHF at once is not diversification — both tend to move against the dollar together, so one dollar trend can put both grids underwater at once.
Pre-flight checklist: check an economic calendar for both currencies over 48 hours; confirm no other grid EA runs on a correlated pair; confirm balance matches the capital table for the GridLevels chosen; confirm MaxDrawdownPercent and EquityProtectionPercent are enabled, not just set; know in dollars what those thresholds mean before attaching the EA, not after.
Step 8: Review the Risk-Control Features Before You Walk Away
- MaxDrawdownPercent (20%): stops new grid orders once drawdown reaches this level; existing positions stay open.
- EquityProtectionPercent (70%): force-closes every position if equity falls below 70% of starting balance — the mechanism from Step 5.
- MaxTotalLots (0.5): caps combined lot size across every open order.
- CloseOnFriday: closes all positions before the weekend, removing gap risk while the market is shut.
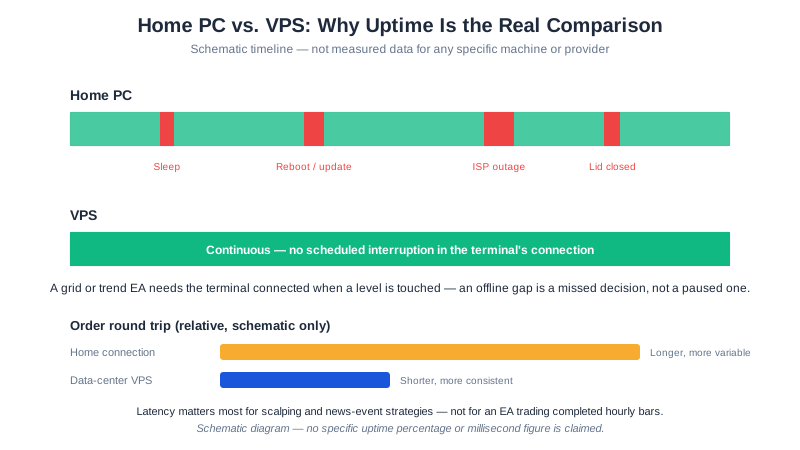
These limit how much a single configuration can lose; they do not make automated trading safe. Each is EA-side logic, not a broker-side stop — if your terminal disconnects, none is being evaluated until MetaTrader reconnects. A VPS keeps the EA present to enforce them.
Common Mistakes to Avoid
- Grid spacing too tight for the pair’s typical volatility — a
GridSizePipsnarrower than the pair’s normal noise fills every level on ordinary movement, not just a real range breakout, so the ladder is fully loaded before a genuine trend even starts. - Raising LotMultiplier above 1.0 without running the arithmetic in Step 6 for your own balance — the setting compounds silently; the account can be carrying several times the risk you think it is before a single alert fires.
- Insufficient capital for the number of grid levels configured — running a 7-level ladder on a 3-level account’s balance means MaxTotalLots or margin gets hit before EquityProtectionPercent ever has a chance to act, so the “safety net” in Step 8 above never gets the space to work as designed.
Download GridMaster EA → | Register your XM account first →
Next Steps
- Grid Trading vs Martingale — why LotMultiplier changes the risk shape
- GridMaster EA download and specifications — the product page: feature list, requirements, and download
- Our full GridMaster risk and feature assessment — the developer review, with the complete parameter table
- Dynamic grid trading settings for EUR/USD — ATR-derived spacing instead of a fixed
GridSizePips - How to Backtest a Forex EA — test settings before going live
- Funding Your Account — the capital table above, explained
- VPS for Forex Trading — keeping the EA present to enforce its own controls
Grid trading involves significant risk including large potential drawdowns. Past performance is not indicative of future results. Full disclaimer