Forex Risk Management: Protecting Your Capital
Risk management is the part of trading that is pure arithmetic, which makes it the part you can get right. This page works through it: what a drawdown costs to recover, how likely a bad streak is, how three sizing methods differ on the same trade, why three “separate” positions are often one bet, and how a stop loss fails. It is one module in the wider forex trading for beginners roadmap, and the one most worth reading twice.
It applies equally to automation. A forex Expert Advisor enforces whatever risk settings you give it, mechanically and around the clock, so a configuration error compounds instead of being noticed.
The Math of Ruin
Losses and gains are not symmetric. A 50% loss requires a 100% gain to undo, because the gain is calculated on a smaller base.
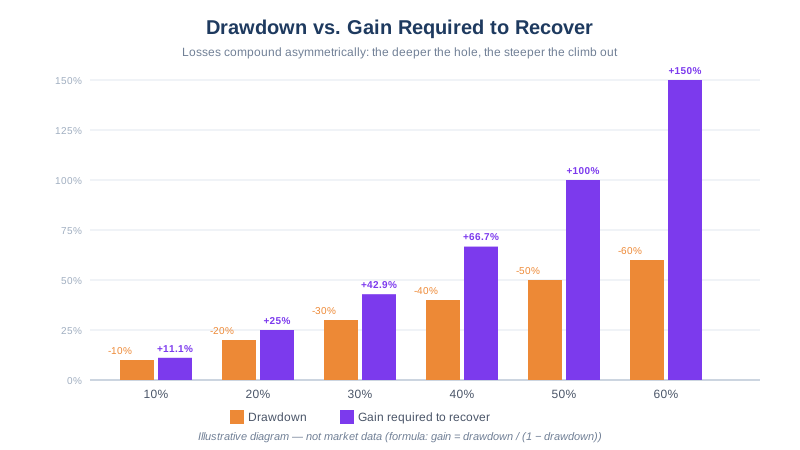
| Drawdown | Gain required to break even |
|---|---|
| 10% | 11.1% |
| 20% | 25.0% |
| 33% | 49.3% |
| 50% | 100.0% |
| 60% | 150.0% |
| 75% | 300.0% |
Check any drawdown percentage — your own account’s, a backtest’s, or a hypothetical one — against this formula directly:
Drawdown-recovery calculator
Enter a drawdown percentage above to calculate the gain required to break even.
Educational tool, not investment advice. The months-to-recover figure assumes a constant monthly return, which real trading returns are not — treat it as an order-of-magnitude check, not a forecast.
The second question is how likely a damaging streak actually is. Take a strategy with a 40% win rate — a perfectly normal figure for a trend-following system with a 1:2 reward-to-risk ratio. Over 100 trades, treating each trade as independent:
| Losing streak somewhere in 100 trades | Approximate probability |
|---|---|
| 5 in a row | ~95% |
| 6 in a row | ~84% |
| 8 in a row | ~47% |
| 10 in a row | ~20% |
| 12 in a row | ~8% |
State the assumption honestly: this treats trades as independent coin flips, which is a simplification. Real losses cluster, because a market regime that breaks your strategy breaks it for weeks. Clustering makes long streaks more likely than the table shows, not less — so read these as a floor.
Now combine the two. An eight-loss streak is close to a coin flip over 100 trades. What does it cost?
| Risk per trade | Account after 8 straight losses | Drawdown | Gain needed to recover |
|---|---|---|---|
| 1% | 92.3% | 7.7% | 8.3% |
| 2% | 85.1% | 14.9% | 17.5% |
| 5% | 66.3% | 33.7% | 50.7% |
| 10% | 43.0% | 57.0% | 132.3% |
That is the whole case for the 1–2% rule. At 2% a likely streak is an annoyance. At 10% the same likely streak has effectively ended the account, because a 132% gain is not something you recover in a quarter.
Reward-to-Risk and the Win Rate You Actually Need
Sizing decides how long you survive; reward-to-risk decides what win rate you need to break even. The relationship is exact: break-even win rate = 1 / (1 + R), where R is reward divided by risk.
| Reward:risk | Break-even win rate | Win rate needed for a 1.3 profit factor |
|---|---|---|
| 1:1 | 50.0% | 56.5% |
| 1.5:1 | 40.0% | 46.4% |
| 2:1 | 33.3% | 39.4% |
| 3:1 | 25.0% | 30.2% |
The right-hand column is the honest target — breaking even is not the goal, and a profit factor of 1.3 is the gate we apply to our own backtests. Both columns also ignore spread: on a 30-pip stop a 1.6-pip spread is 5.3% of your risk per trade, so add roughly two percentage points before you believe either figure.
Position Sizing Three Ways
The general formula is always the same:
Lots = (Balance × Risk %) / (Stop in pips × Pip value per lot)
Run that formula on your own numbers below — the fields default to a 1% risk example and EUR/USD’s fixed $10 standard-lot pip value; switch the pair and it recalculates automatically, prompting for a current rate on JPY pairs and other crosses. Bookmark the standalone position-size calculator if you want it without scrolling back to this guide.
Position-size calculator
Enter your account balance and stop-loss distance above to calculate.
Educational tool, not investment advice. Verify the calculation and your broker's minimum lot size before placing a trade.
Take one concrete trade: a $2,000 account, long EUR/USD, with structural invalidation 50 pips below entry. Assume $10 per pip per standard lot, and an ATR(14) reading of 18 pips on the entry timeframe.
| Method | Rule applied | Lot size | Dollar risk | % of account |
|---|---|---|---|---|
| Fixed-fractional | 1% of equity, 50-pip stop | 0.04 | $20.00 | 1.0% |
| Fixed-lot | Always trade 0.10 | 0.10 | $50.00 | 2.5% |
| ATR-based | 1% of equity, stop = 1.5 × ATR = 27 pips | 0.07 | $18.90 | 0.95% |
Three defensible methods, and the same trade carries between $18.90 and $50.00 of risk depending on which you use. Each has a specific failure mode:
Fixed-fractional fails at the bottom of the account. Because it shrinks after losses, recovery is slower than the drawdown was — that is the price of never being ruined, and it is worth paying. The real problem is granularity: on a $300 account with a 60-pip stop, 1% is $3, which computes to 0.005 lots. That is below the 0.01 broker minimum, so you either skip the trade or trade 0.01 and silently risk 2%.
Fixed-lot fails as the balance moves. Trading 0.10 lots is 2.5% risk at $2,000 and 5% at $1,000. The method raises your risk percentage exactly as the account becomes less able to absorb it, which is the wrong direction on the one occasion it matters.
ATR-based fails when volatility collapses. The stop is proportional to recent range, so a quiet week produces a very tight stop and therefore a very large position. When volatility snaps back — and it snaps back faster than it decays — the realised loss exceeds the model’s estimate. Any ATR sizing rule needs a hard floor on stop distance in pips.
Correlation: The Risk You Think You Don’t Have
Suppose you open three positions at 2% risk each: long EUR/USD, long GBP/USD, short USD/CHF. You believe you are risking 2% on each of three ideas. You are not. All three are the same trade.
| Position | Direction of USD exposure |
|---|---|
| Long EUR/USD | Short USD |
| Long GBP/USD | Short USD |
| Long AUD/USD | Short USD |
| Short USD/CHF | Short USD |
| Short USD/JPY | Short USD |
| Long USD/CAD | Long USD |
A broad dollar rally moves all three against you at once. The pairs are not perfectly correlated, so the combined loss is not exactly 6% — but it is far nearer 5–6% than the 2% you budgeted, and the diversification you believed you had is close to zero.
A concrete cap. Score every open position by its USD sign from the table above, then limit total same-direction USD exposure to twice your per-trade risk. At 2% per trade that allows two positions on the same side of the dollar and no more. If you want a third idea, it has to be on the other side, or on a cross with no dollar leg at all.
Take the same $2,000 account from the position-sizing example above, this time run as three “separate” 2% trades: long EUR/USD, long GBP/USD, short USD/CHF, each with a stop sized to risk $40. On paper that’s $120 of budgeted risk across three ideas. Scored by USD sign, all three are short-dollar, so a broad dollar rally that fully triggers all three stops costs closer to the full $120 in one move — the same outcome, on this account, as a single 6% trade would have produced. Nothing about the arithmetic changed; only the label “three trades” made the exposure look diversified when it wasn’t.
Honest Failure Modes
Gaps beat stops. A stop is an instruction to close at the next available price once your level trades — not a promise of that price. Set a stop 50 pips below entry, get a Sunday open 100 pips lower, and you are filled around 100 pips down. Your 1% trade became a 2% trade with no error on your part. The same happens on scheduled releases.
Slippage is a running cost, not an anomaly. Even in normal conditions a stop triggered in a fast move fills a pip or two beyond the level. Over hundreds of trades that is a permanent tax on the losing side of your distribution, and it is one of the things a backtest routinely understates.
Guaranteed stops are a product, not a feature. Some brokers offer guaranteed stop-loss orders that do cap the loss at the level. They cost a premium or a wider spread, are not offered by every broker, and availability commonly depends on which regulated entity holds your account. Do not assume you have one.
Negative balance protection is broker policy. Many brokers write off a negative balance after a catastrophic gap. It is a commercial policy tied to a specific regulated entity, not a property of the forex market, and it varies. Read your own account terms rather than an article about someone else’s.
Risk Management on an Automated Account
Automation removes the discipline problem and replaces it with a configuration problem.
An EA enforces the setting you gave it, including a wrong one. A human who fat-fingers 20% risk instead of 2% notices after the first trade. An EA does not notice, and will apply it to every trade at 3am. Check the risk input, then check it again on demo, before the first live position.
Risk stacks across concurrent EAs. Two EAs configured at 2% each, both long EUR-family pairs, are running a 4% position — and neither one knows the other exists. On the same $2,000 account used above, that is $80 of combined risk sitting under a single “long EUR-family” bet, computed by the same terminal that would flag a manually-opened second position as risky if you noticed it yourself. The correlation cap above applies to your whole terminal, not to each EA separately.
Your drawdown is your setting. Our own performance page says it directly: “Drawdown is a setting, not a property of the strategy.” The sub-1% maximum drawdowns in our published backtests are a consequence of the small fixed risk fraction and single-position limit used in the test, not evidence that those strategies are low-risk. Raise the risk percentage or run several EAs at once and those numbers change completely. Any published drawdown figure — ours or anyone’s — is a statement about a configuration, and it should be read that way.
Test the configuration before it touches capital: open a free XM account and run the settings on demo first, following the demo account guide.
What to Read Next
- Lot Sizes Explained — pip value, the minimum-lot floor, and the sizing arithmetic
- What is Forex Trading? — spread costs, leverage, and the margin-call arithmetic
- First Trade Checklist — what to verify before every position
- How to Choose a Forex EA in 2026 — evaluating an EA’s risk controls
- Backtest Results & Methodology — our published figures and their limits
This article is for educational purposes only and does not constitute financial advice. Trading forex carries significant risk of loss.