What Forex Trading Actually Is, vs What Social Media Implies
Forex trading is the buying and selling of one currency against another. It is the largest financial market in the world, with roughly $7.5 trillion changing hands daily, as published by the Bank for International Settlements in its Triennial Central Bank Survey, October 2022. That fact alone is often used to imply something it doesn’t prove — that a market this large must be an easy, obvious way to make money. It doesn’t follow, and this page is built around checking that implication, and five others like it, against the actual mechanics of a trade.
Most beginner content stops at the headline. This page is the mechanics instead: what you hold when a trade is open, what a pip is worth in dollars, what one round trip costs, and how leverage turns a modest adverse move into a closed account. For the orientation-level overview — brokers, routine, psychology — read forex trading for beginners first.
Myth: Buying EUR/USD Means You Own Euros
Nothing is delivered. Retail spot forex is a rolling contract for the difference in price, not a purchase of euros. Buy 0.10 lots of EUR/USD and you are long 10,000 euros and short the dollar equivalent; no euros arrive in an account anywhere.
Spot FX settles two business days after the trade date. Because retail traders do not want delivery, the broker rolls the position each day around 21:00 GMT and charges or credits the interest-rate differential. That charge is the swap, or rollover.
A worked carry example. The rates below are round illustrative figures chosen so the arithmetic is checkable, not current market rates. Say the dollar’s overnight rate is 4.5% and the euro’s is 2.0%. Long EUR/USD means holding the lower-yielding currency and owing the higher-yielding one, so you pay roughly the 2.5% differential plus the broker’s markup.
- Position: 0.10 lots = 10,000 EUR, worth about $10,844 at 1.0844
- Annual cost at 2.5%: $271
- Per day: $271 / 365 = about $0.74 debit
Hold that for a month and you have paid roughly $22 before price does anything. The opposite side earns a smaller credit than $0.74, because the broker spreads the swap in both directions. Most brokers also apply a triple swap on Wednesday to cover weekend settlement — about $2.22 on the position above. Swap is irrelevant for a day trade and decisive over months.
Myth: A Pip Is Always Worth $10
A pip is the fourth decimal place for most pairs (0.0001) and the second for yen pairs (0.01). The fifth decimal on a modern quote is a pipette, one tenth of a pip. The dollar value of a pip depends on the quote currency — the second one in the pair — not on whether the pair “involves USD.”
| Lot size | Units | Pip value, USD-quoted pairs (EUR/USD, GBP/USD) | Pip value, USD/JPY at 150.00 |
|---|---|---|---|
| Standard (1.00) | 100,000 | $10.00 | $6.67 |
| Mini (0.10) | 10,000 | $1.00 | $0.67 |
| Micro (0.01) | 1,000 | $0.10 | $0.067 |
The yen exception, arithmetically. On USD/JPY the quote currency is the yen, so one pip of a standard lot is 100,000 × 0.01 = ¥1,000. Converting at 150.00 gives ¥1,000 / 150.00 = $6.67 — not $10, and it drifts as the rate moves. Sizing USD/JPY as though a pip were worth $10 under-risks you by a third: a benign error in this direction, but still an error in a calculation you believed was exact. Lot sizes explained works through crosses and non-USD account denominations, and the pip-value calculator does the conversion for any pair once you enter the current rate.
Myth: The Spread Is Too Small to Matter
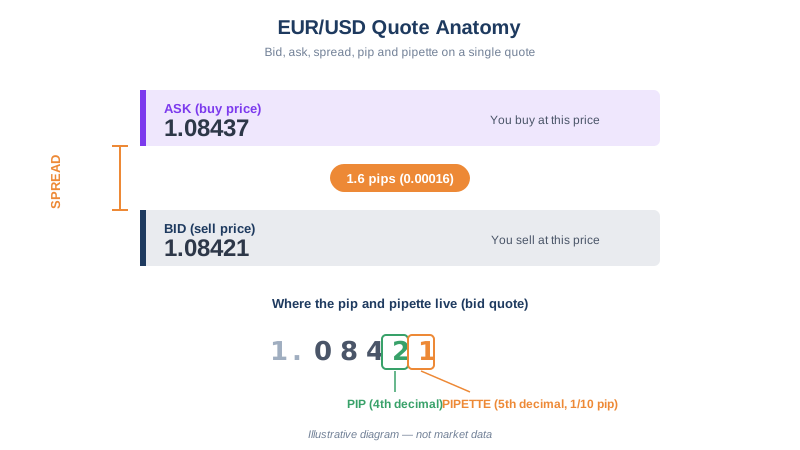
Take the quote in the diagram above: bid 1.08421, ask 1.08437, a spread of 1.6 pips. That is the published EUR/USD spread on the XM Standard account, as published by XM, August 2026. Trade size 0.05 lots, so each pip is worth $0.50.
You enter by paying the ask, 1.08437. The moment you are filled the position shows a 1.6-pip loss, $0.80, because closing means selling at the bid.
The winning version. Take profit set 60 pips above your entry, at 1.09037. To close a long you sell at the bid, so the bid must reach 1.09037 — which is 61.6 pips above where the bid was quoted when you clicked.
- Market travel required: 61.6 pips
- Pips you keep: 60.0 × $0.50 = +$30.00
- Spread cost, already inside that figure: 1.6 pips × $0.50 = $0.80
The losing version. Stop loss set 30 pips below your entry, at 1.08137. The bid was 1.08421 when you entered, so the market only has to fall 28.4 pips to take a 30-pip loss.
- Market travel required: 28.4 pips
- Pips you lose: 30.0 × $0.50 = −$15.00
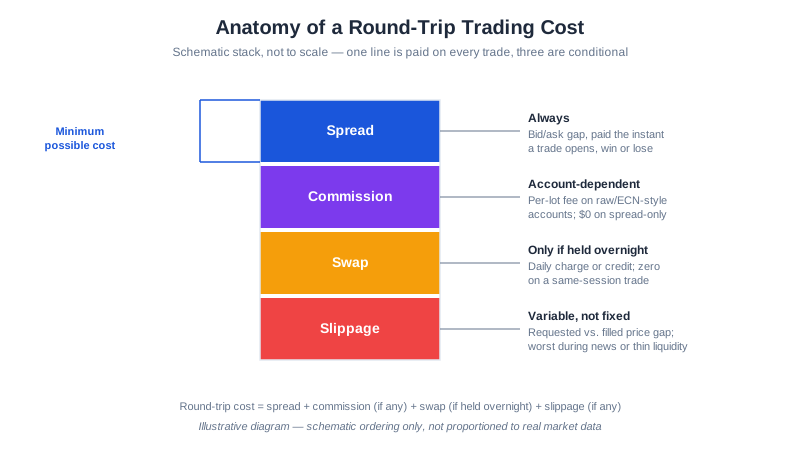
This asymmetry is the entire economics of the spread: the market must travel 61.6 pips to pay you and 28.4 pips to charge you. On a 30-pip stop, the 1.6-pip spread consumes 5.3% of your risk budget on every trade, win or lose, and at 200 trades a year on 0.05 lots that is 200 × $0.80 = $160 to the spread alone. Frequency amplifies it: a strategy targeting 10 pips hands over 16% of its target before it starts, which is why scalping systems that look excellent in simulation frequently fail live. Understanding spreads and commissions covers the account-type trade-offs.
Myth: More Leverage Just Means More Profit Potential
Leverage does not make a trade better. It sets how much notional exposure a deposit can support, scaling profit and loss identically and raising the probability that a normal adverse move closes the account. Expected return per pip is unchanged; variance and ruin probability are not.
The maximum-leverage case. A $500 account at 1:500 supports $250,000 of notional — about 2.30 standard lots of EUR/USD at 1.0844, worth $23 per pip. Margin used is $250,000 / 500 = $500, leaving essentially no free margin, so a single adverse pip triggers liquidation. Nobody sensible does this, but it is what “1:500 leverage” literally permits.
A more realistic case. Same $500 account, 0.50 lots:
- Notional: 50,000 × 1.0844 = $54,220
- Margin required at 1:500: $54,220 / 500 = $108.44
- Free margin: $500 − $108.44 = $391.56
- Pip value: $5.00
Brokers publish a stop-out level — the margin level at which they begin force-closing positions. At a 20% stop-out, positions close when equity falls to 0.20 × $108.44 = $21.69. That is $478 of loss, or about 96 pips, a distance EUR/USD covers in a routine session. Check your own broker’s published margin call and stop-out levels; they differ by broker and by regulated entity.
Leverage is really a constraint on survivable stop distance, and most beginners learn this by being liquidated rather than by doing the division. Risk management covers the sizing that prevents it, and the position-size calculator turns balance, risk %, and stop distance into a lot size directly.
Myth: Prices Move Randomly, or Because “They” Manipulate It
Four inputs dominate — identifiable, not random and not a conspiracy — and the first is the one beginners misread:
- Interest-rate expectations — not current rates, but the forecast of the next central bank move. Prices respond to the change in expectation, which is why a fully anticipated hike often produces no move at all.
- Inflation and growth data — CPI, GDP, and employment releases move rate expectations, which move currencies.
- Risk sentiment — the dollar, yen, and franc typically strengthen when markets are fearful, regardless of their own fundamentals.
- Positioning — when everyone is already long there is nobody left to buy, and unwinds turn violent without news.
Around scheduled releases spreads widen and slippage becomes real. Treat the economic calendar as a list of times when your risk model stops being accurate; forex trading sessions covers when liquidity is deepest.
These four inputs are not abstract. A commodity shock can move USD/CAD and other oil-linked pairs within hours — see our write-up of the oil price collapse’s forex impact for a worked example. A single corporate earnings release can move USD/JPY too, when it changes the risk-sentiment picture broadly enough — our FedEx earnings USD/JPY signal post walks through one such case.
The chart above shows daily EUR/USD candles. Each candle records four prices — open, high, low, close — for one trading day, and the distance between high and low is the range you are sizing stops against. Identifying which of those prices have mattered repeatedly is covered in technical analysis basics, worked through on one pair in our EUR/USD technical analysis guide.
Myth: The Traders Posting Wins Online Represent the Average Outcome
They don’t, and it’s worth saying plainly: most retail traders who trade forex lose money. XM’s own regulatory risk disclosure states that 75.12% of retail investor accounts lose money trading CFDs with that provider (as published by XM, August 2026), and every regulated broker in the EU and UK publishes a comparable figure, clustering in the same 70–80% band. A social media feed selected for screenshots of winning trades is not a sample of that population — it’s a survivorship-biased slice of it. That is not a pessimist’s warning label; it is the measured outcome for the population you are joining.
Two implications follow from the arithmetic above. Cost is not a rounding error: 200 trades a year means paying the spread 200 times, and the strategy must clear that before it earns anything. And leverage makes the distance between “a bad week” and “no account” far shorter than it looks — beginners are rarely destroyed by picking the wrong direction, they are destroyed by size.
To watch these mechanics on a live quote with no capital at risk, open a free XM account and run it on demo — the demo account guide covers setup and the first trade checklist is what to run before going live.
Frequently Asked Questions
How much money do I need to start forex trading?
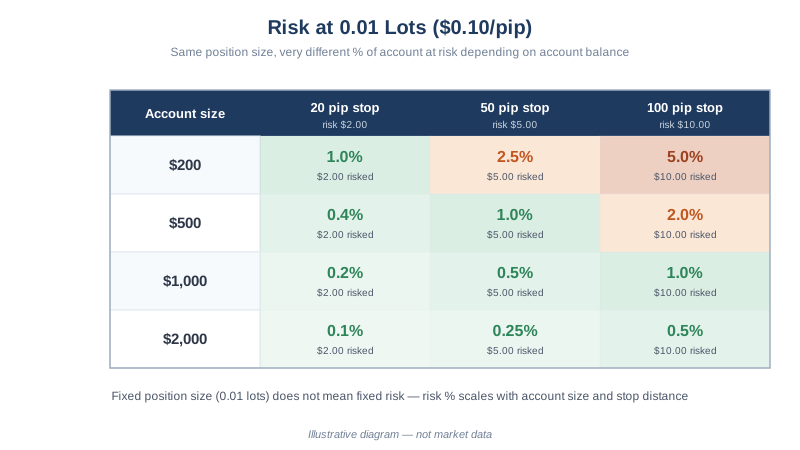
Brokers accept deposits as low as $5, but that is an account-opening minimum, not a workable one. The real floor is set by the smallest position you can trade. At 0.01 lots a 100-pip stop risks $10, so keeping that inside a 2% risk limit needs at least $500. Under about $200 the position-sizing arithmetic breaks down entirely and you are forced to over-risk.
Can I lose more than I deposit in forex trading?
In principle yes: a weekend gap can jump past your stop and leave the position closed below zero. Many brokers offer negative balance protection that writes off the shortfall, but it is a broker policy rather than a market rule, and it often depends on which regulated entity holds your account. Check the terms of your specific entity before assuming you have it.
Is forex trading just gambling?
The mechanics differ: a casino game has a fixed negative expectancy you cannot alter, while a forex position has an expectancy set by your rules, costs, and sizing. That said, a trader with no tested edge who pays spread on every trade has manufactured a negative-expectancy game, which is functionally gambling. The distinction is whether you can state and measure your edge.
Do I have to pay tax on forex profits?
Almost certainly, but how depends entirely on where you are tax-resident, whether the activity is treated as investment, speculation, or business income, and the instrument you traded. Treatment varies widely between jurisdictions and changes. We are not tax advisers and do not give tax advice. Keep complete trade records from your first trade and ask a qualified local professional.
How long does it take to become profitable at forex trading?
The honest answer is that most people never get there. XM discloses that 75.12% of its retail investor accounts lose money trading CFDs. Among those who do reach consistency, the process is usually measured in years rather than months, and it depends more on surviving long enough to learn than on finding a strategy. Plan for tuition costs, not income.
Next Steps
- Forex Trading for Beginners — the orientation guide: brokers, routine, first steps
- Lot Sizes Explained — pip value by quote currency and the minimum-lot floor
- Forex Risk Management Guide — position sizing and drawdown arithmetic
- Understanding Spreads and Commissions — what you actually pay per trade
- Technical Analysis Basics — reading the chart above
This article is for educational purposes only and does not constitute financial advice. Trading forex carries significant risk. Never trade with money you cannot afford to lose.