EA Backtest Results & Testing Methodology
Read this first. Every figure on this page is a hypothetical, backtested result produced in a strategy tester on historical data. None of it is live-account performance. Hypothetical results have inherent limitations: they are generated with the benefit of hindsight, no money was ever at risk, and simulation cannot fully reproduce slippage, requotes, liquidity gaps, or broker execution behaviour. Backtested performance does not indicate future results, and no result on this page should be read as a prediction of what your account will do.
We publish figures for the EAs we have completed testing on, and we say plainly where we have no data. We do not publish live-account results, because we do not have a verified live track record to show. If you are new to what an Expert Advisor is, start there before reading these numbers — it explains what a backtest can and cannot promise.
At a Glance: Which EAs Pass Our Quality Gate
Hypothetical backtest, as of September 21, 2026. Pass means profit factor > 1.3, max drawdown < 30%, and (on the EA’s primary pair) more than 50 trades over the 2024-01 → 2026-03 test window — see Testing Methodology below for the full gate definition.
| EA | EURUSD | GBPUSD | USDJPY |
|---|---|---|---|
| SnapBack | Pass | Pass | Did not pass |
| QuickPulse | Did not pass | Did not pass | Did not pass |
| DualHorizon | Pass | Did not pass | Did not pass |
Only SnapBack (EURUSD, GBPUSD) and DualHorizon (EURUSD) currently clear the gate. Full trade counts, profit factor, win rate, drawdown, net return and an equity curve for every row are in the Published Backtest Results tables below.
The drawdown and net-return columns in those tables are fractions of one percent, and that is not a typo or a rounding error: the test harness stakes only about 10% of the account’s free equity on each trade, with no leverage on top and one position open at a time, so both numbers come out small by construction — see Why the Drawdown and Return Figures Look Small.
Correction History
We keep a permanent record of restatements on this page rather than quietly overwriting old figures. When a testing defect changes a published number, the entry below stays as the account of what changed, why, and what the number was replaced with; it is not deleted or folded away once superseded. Any future correction will be appended as a new dated entry rather than merged into this one.
September 21, 2026 — re-run, no restatement. We re-downloaded the price data from scratch and re-ran all nine EA/pair tests in order to publish the equity curves further down this page. Every trade count, profit factor, win rate and drawdown came back identical to the July 30 figures, so nothing in the tables has been changed. This is a verification, not a correction, and it is recorded here only so the September date on the tables is not mistaken for a quiet restatement.
July 30, 2026 — High/Low Decoder Bug
The figures previously published on this page were wrong, and we have replaced them.
Our backtest engine reads Dukascopy hourly bar files directly. It was decoding each bar’s two extreme prices in the wrong order — the intrabar high and low were inverted on every single bar. That corrupts everything that depends on the range of a bar: stop-loss and take-profit touch detection, ATR, and the ADX directional components. Every number we had published from this pipeline was therefore produced on impossible price data.
We found the defect, fixed it, deleted the cached data, re-downloaded it, and re-ran every published test with no changes to any EA’s parameters. The corrected results are worse than what we had published, and we have published them anyway:
- SnapBack still clears our quality gate on EURUSD and GBPUSD, though GBPUSD is materially weaker than the figure we showed.
- QuickPulse no longer passes on any pair. Every pair now finishes flat-to-negative over the window. We are not recommending it for live use.
- DualHorizon now passes on EURUSD only. USDJPY, which we previously recommended, no longer clears the gate.
SnapBack, QuickPulse, and DualHorizon are our three newest EAs — see the release notes for the reasoning behind each design before reading the corrected figures below.
We also corrected this page’s methodology section, which described the wrong testing platform (see below).
Published Backtest Results
Test conditions for all three: EUR/USD-family majors, H1 timeframe, 2024-01 → 2026-03, bid-candle data with spread modelled. Re-run July 30, 2026 on corrected data, and re-run again on September 21, 2026 to produce the equity curves below — that re-run reproduced every figure in these tables exactly, so nothing here has been restated.
About the net return column. Net return is the change in the test account’s balance across the whole 26-month window, as a percentage of the $10,000 it started with. It is a small number for the same reason the drawdowns are small: the harness puts roughly 10% of the account’s free equity into each position, applies no leverage on top of that, and holds one position at a time. Return and drawdown therefore scale together — stake twice as much per trade and both roughly double. Read the two columns as a pair; the net return on its own says nothing about how much risk produced it.
SnapBack EA — Mean Reversion
Hypothetical backtest, as of September 21, 2026.
| Pair | Trades | Profit Factor | Win Rate | Max Drawdown | Net Return |
|---|---|---|---|---|---|
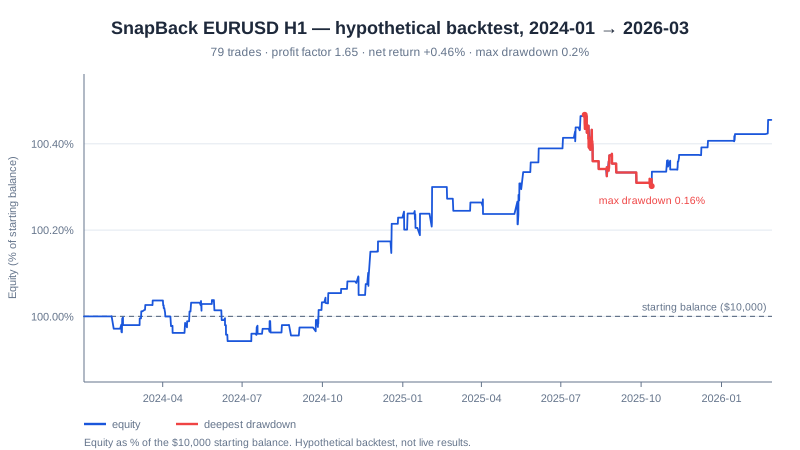
| EURUSD | 79 | 1.65 | 62.0% | 0.2% | +0.46% |
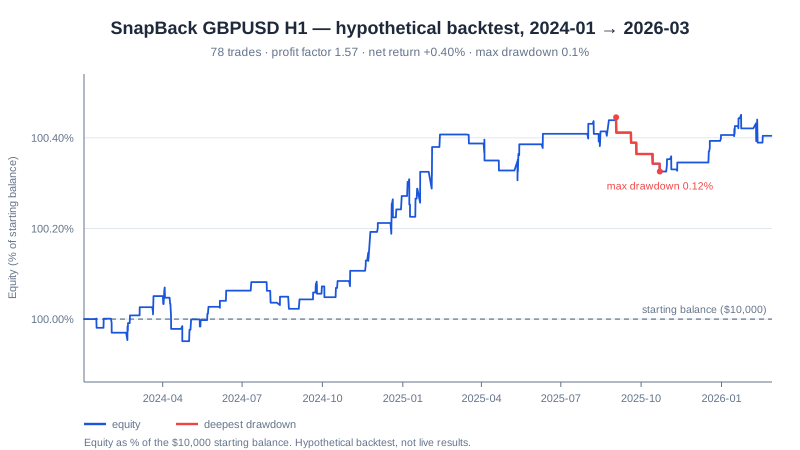
| GBPUSD | 78 | 1.57 | 61.5% | 0.1% | +0.40% |
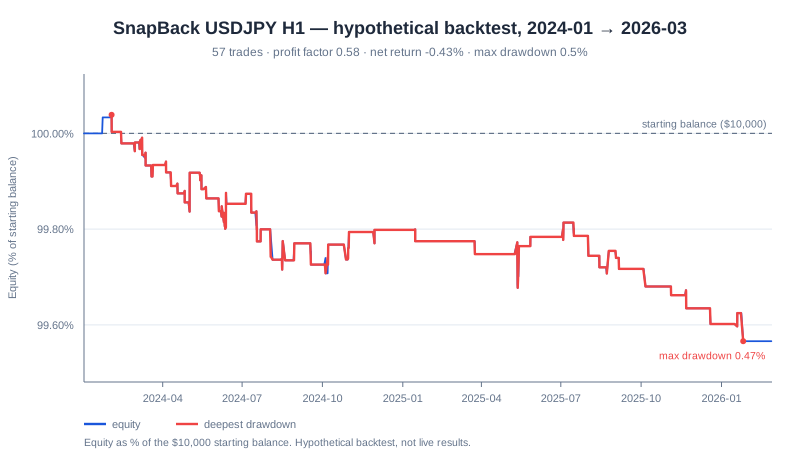
| USDJPY | 57 | 0.58 — did not pass | 33.3% | 0.5% | −0.43% |
EURUSD and GBPUSD clear our PF > 1.3 gate. USDJPY loses money over the window, so we do not recommend SnapBack on that pair. Full EA details
QuickPulse EA — Contrarian Dip Buying
Hypothetical backtest, as of September 21, 2026.
| Pair | Trades | Profit Factor | Win Rate | Max Drawdown | Net Return |
|---|---|---|---|---|---|
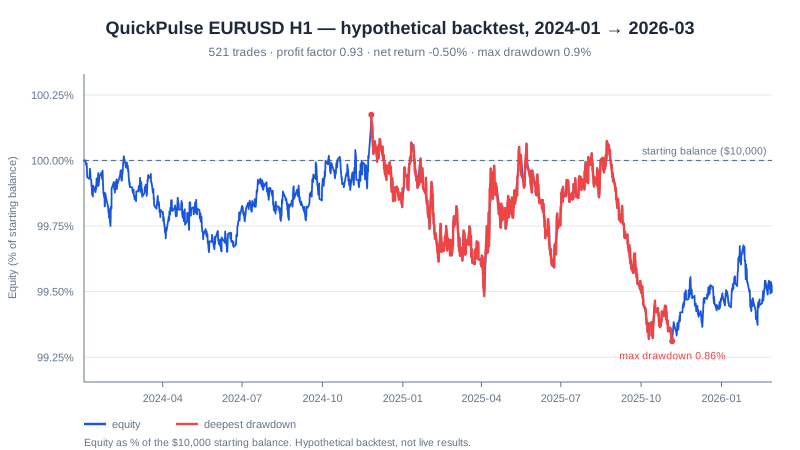
| EURUSD | 521 | 0.93 — did not pass | 17.5% | 0.9% | −0.50% |
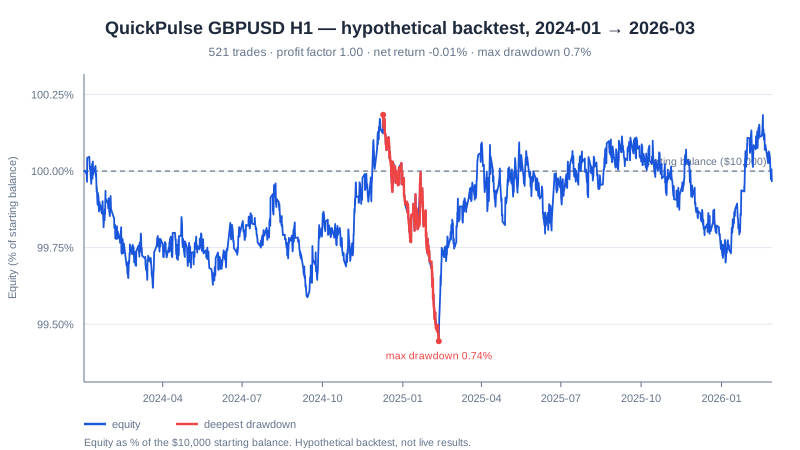
| GBPUSD | 521 | 1.00 — did not pass | 19.0% | 0.7% | −0.01% |
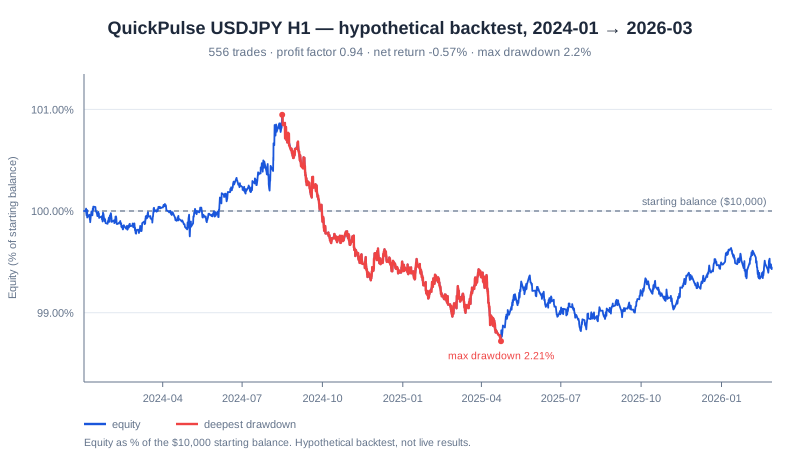
| USDJPY | 556 | 0.94 — did not pass | 17.8% | 2.2% | −0.57% |
No pair passes. On corrected data QuickPulse is flat to slightly negative everywhere: the low win rate this strategy accepts by design is no longer paid for by the winners. The EA remains downloadable, but we do not recommend it on any pair and we will not publish a recommendation for it until a re-worked version passes on clean data. Full EA details
DualHorizon EA — Multi-Timeframe Trend
Hypothetical backtest, as of September 21, 2026.
| Pair | Trades | Profit Factor | Win Rate | Max Drawdown | Net Return |
|---|---|---|---|---|---|
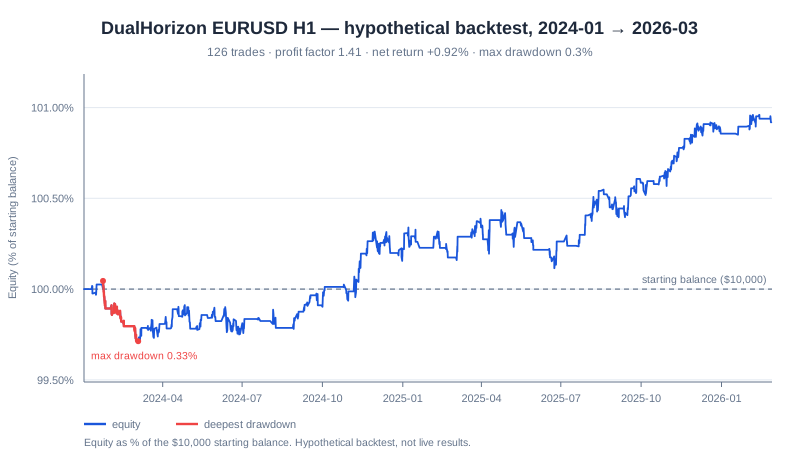
| EURUSD | 126 | 1.41 | 34.1% | 0.3% | +0.92% |
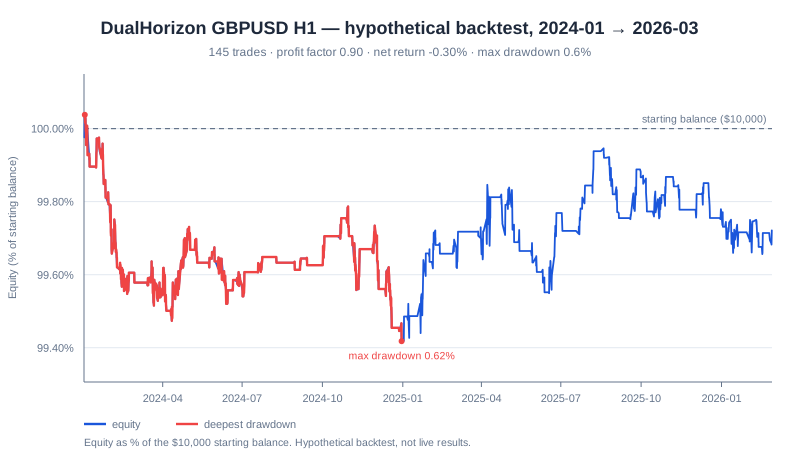
| GBPUSD | 145 | 0.90 — did not pass | 26.2% | 0.6% | −0.30% |
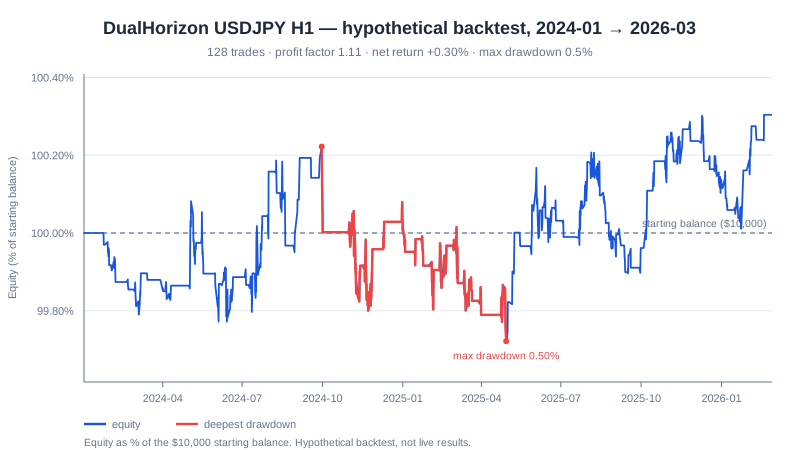
| USDJPY | 128 | 1.11 — did not pass | 27.3% | 0.5% | +0.30% |
Only EURUSD clears the gate. USDJPY is profitable over the window but below our PF > 1.3 threshold, and GBPUSD is negative — neither is recommended. Full EA details
Live Demo Tracking
We do not publish a live-account record because we do not have one. Third-party-verified demo accounts running our EAs are the next step; once they are connected, their public trackers appear below with the tracker’s own figures, always labelled as demo results.
EAs Without Published Figures
SteadyPips EA, GridMaster EA, BreakWave EA and TripleAlign EA do not yet have published backtest tables here. Each of those pages instead shows a rule-based strategy schematic — a diagram of the entry/exit mechanics, not a profit curve or a measured result set — and it is labelled as such on each page. We would rather show nothing than show a number, or a chart shape, we cannot stand behind.
Why the Drawdown and Return Figures Look Small
The sub-1% maximum drawdowns and the sub-1% net returns above are both a function of the position sizing used in the test, not evidence that these strategies are low-risk or low-reward. In plain words, the sizing rule is: on every entry, buy as much of the pair as roughly 10% of the account’s currently free equity will pay for outright — no leverage applied on top — and hold one position at a time. On the $10,000 starting balance that is about $1,000 of currency per trade, so a stop-out moves the account by a fraction of one percent.
That is why the two columns move together. Both the net return and the maximum drawdown scale almost linearly with that 10%: stake 20% instead and both roughly double; stake 100% and both grow about tenfold, along with the risk of a single bad run. Raise the fraction, run several EAs at once, add leverage, or run the same logic on a $200 account and every percentage on this page changes. Drawdown and return are settings here, not properties of the strategy — the numbers that describe the strategy itself are the profit factor, the win rate and the trade count.
Testing Methodology
- Platform: a custom Python backtesting pipeline built on the open-source backtesting.py library — not the MetaTrader Strategy Tester. (This page previously named the MetaTrader Strategy Tester; that was incorrect and has been corrected. See the correction history above.)
- Data: Dukascopy hourly bid candles, downloaded and decoded directly from their public bar files, with the broker spread modelled as a per-trade cost
- Test window: 2024-01-01 to 2026-03-01, fixed for every EA and pair — no per-EA window shopping
- Timeframe: H1 (hourly bars)
- Initial deposit: $10,000
- Position sizing: each entry buys whatever quantity roughly 10% of the account’s free equity pays for outright, with no leverage applied on top — about $1,000 of currency on the opening balance. See the note above for what that does to the drawdown and net-return columns
- Positions: one at a time. The harness closes any open position before opening the next one, so an EA’s own higher position cap (DualHorizon allows three) is not exercised in these tests
- Equity curves: the chart under each table is drawn from the harness’s own hour-by-hour equity series for that run, not redrawn by hand; the underlying
data/backtests/<EA>_<PAIR>_equity.csvfiles are in the repository - Quality gate: all three of the following, checked by the same script that produced the tables above — profit factor above 1.3 over the test window; maximum drawdown below 30%; and, on the EA’s primary pair, more than 50 trades over the window. These are our own thresholds, not an industry standard, and a pair/EA combination that misses any one of them is marked “did not pass” and is not recommended for live use.
The Python harness is a faithful but simplified model of each EA: it reproduces the entry and exit logic and the ATR-based stop and target, but it does not model every refinement in the MetaTrader builds (for example DualHorizon’s H4 filter and trailing stop). Those omissions make the test more permissive than the live EA, not less.
For how our EAs are generated, tested and released, see our editorial policy.
What We Have Not Done
- No live-account track record. We have not published verified live results, and you should treat the absence as meaningful.
- No forward-test results yet. Demo forward tests are in progress; nothing will be published here until there is a meaningful sample. Any interim claim would be noise.
- No out-of-sample guarantee. A 26-month window is short. Strategies that pass it can still fail when the market regime changes — this is the single most common way backtested edges disappear.
- No MetaTrader Strategy Tester cross-check yet. The figures above come from our own Python harness. We have not yet re-validated them inside MetaTrader, and until we do, treat them as one implementation’s answer rather than a confirmed one.
Want to run these tests yourself rather than take our word for it? Our backtesting guide walks through the exact process, including the data-quality traps that make most published EA backtests unreliable.
Frequently Asked Questions
How are these backtests run?
A custom Python pipeline built on the open-source backtesting.py library, not the MetaTrader Strategy Tester. It runs each EA on Dukascopy hourly bid candles from 2024-01-01 to 2026-03-01 with the broker spread modelled as a per-trade cost, starting from a $10,000 deposit, with each entry sized at roughly 10% of the account’s free equity and no leverage on top.
Why were the results on this page corrected on July 30, 2026?
The backtest engine decoded each hourly bar’s high and low in the wrong order, which corrupted every stop-loss and take-profit touch check plus the ATR and ADX calculations built on top of it. We fixed the decoder, deleted and re-downloaded the cached data, and re-ran every published test with no changes to any EA’s parameters. The corrected figures are worse than what we had shown before, and we published them anyway — see Correction History above.
What is the quality gate an EA/pair combination has to clear to be recommended?
Profit factor above 1.3 over the test window, maximum drawdown below 30%, and more than 50 trades on the EA’s primary pair. All three are our own threshold, not an industry standard, and they are enforced by the same script that produced the tables on this page.
Which EAs currently pass the quality gate?
SnapBack passes on EURUSD and GBPUSD but not USDJPY. DualHorizon passes on EURUSD only. QuickPulse does not pass on any pair and is not recommended for live use until a re-worked version clears clean data.
Try the EAs
- Download the free EAs — all seven, MT4 and MT5 builds
- Test on a demo account first — you risk no capital while you learn the settings, though demo fills are more forgiving than live ones
- Open a free XM account — required for EA activation
Data License
The backtest result tables on this page are published under the Creative Commons Attribution 4.0 (CC BY 4.0) license. You may reuse or quote this data with attribution to SteadyPips.
Hypothetical backtested results are shown throughout this page and do not indicate future performance. All trading involves substantial risk of loss. Please read our risk disclosure before trading.